Seneste videoer
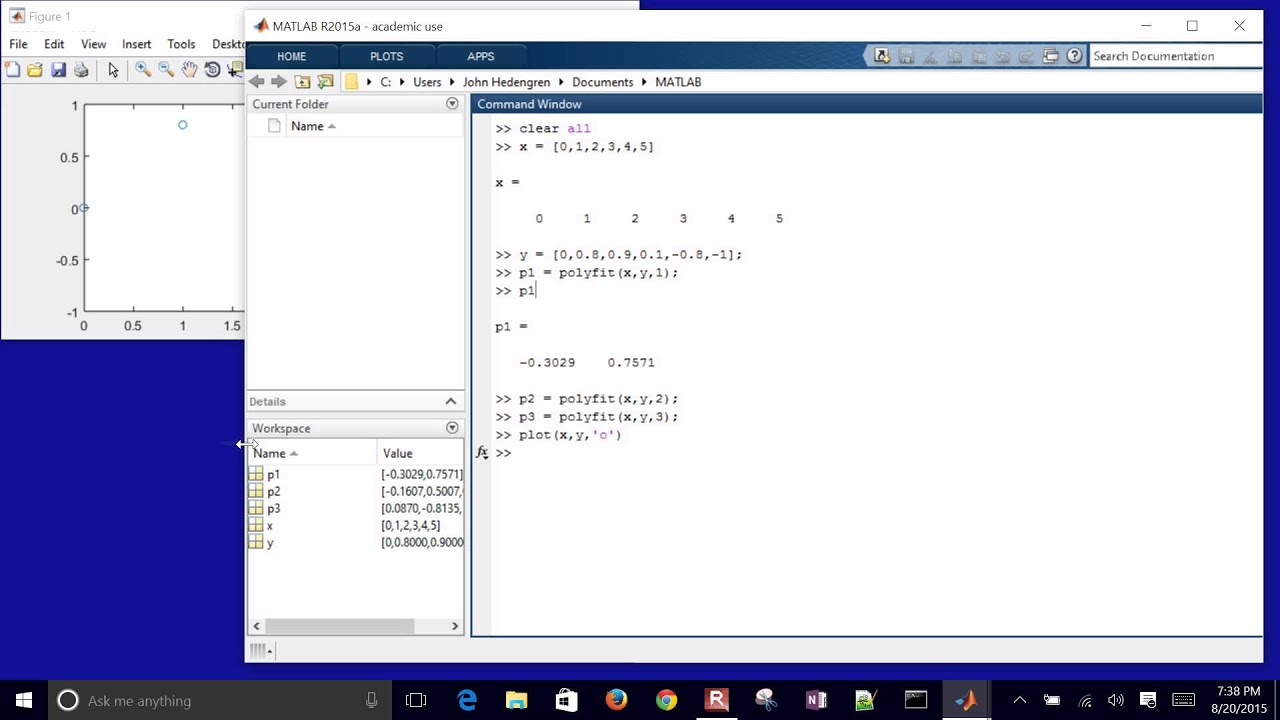
Data regression is an empirical method to develop correlations. This tutorial demonstrates how to use MATLAB to fit a line and polynomial functions along with plotting the results and performing a basic statistical analysis.

Linear and polynomial regression is demonstrated in Excel. The data is show on a plot with trend lines added as linear, quadratic, and cubic correlations.
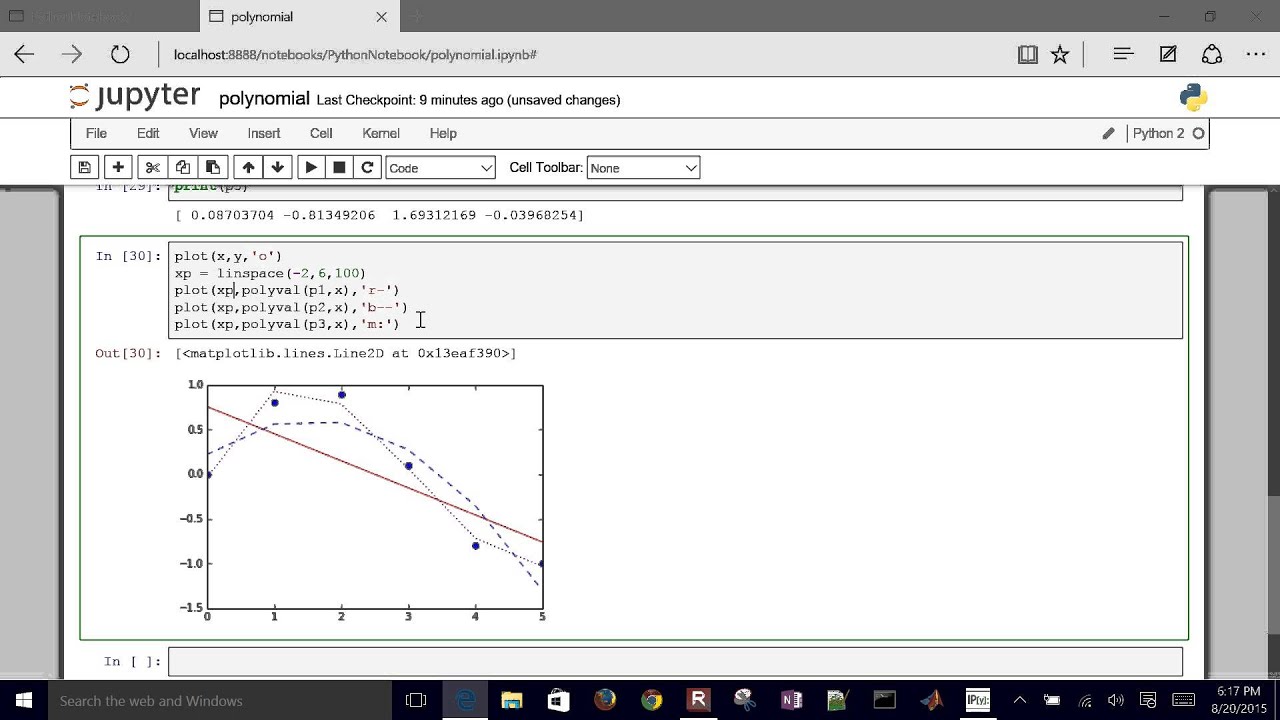
This brief tutorial demonstrates how to use Numpy and SciPy functions in Python to regress linear or polynomial functions that minimize the least squares difference between measured and predicted values. Source Code: https://apmonitor.com/che263/i....ndex.php/Main/Python

This tutorial covers the APM toolbox of Python to solve and optimize parameters to match measurements in a dynamic system. In this exercise, the model is simulated and optimized simultaneously through an orthogonal collocation on finite elements.
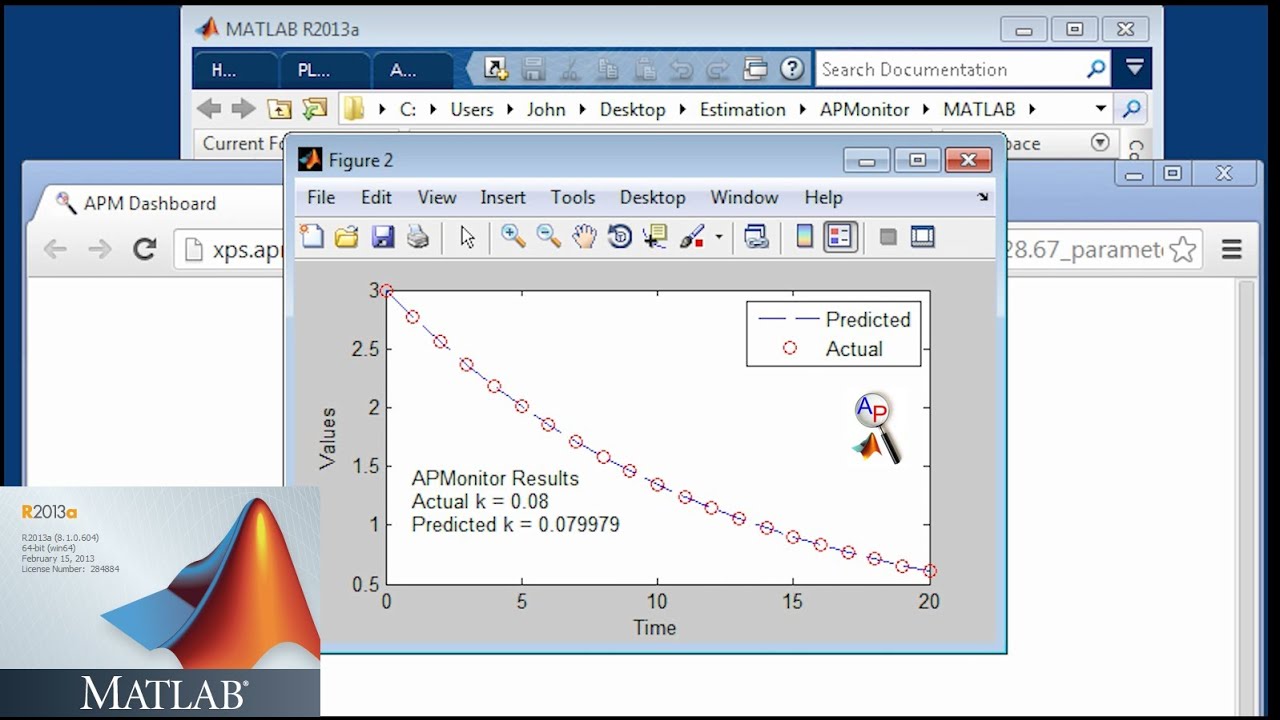
This tutorial covers the APM toolbox of MATLAB to solve and optimize parameters to match measurements in a dynamic system. In this exercise, the model is simulated and optimized simultaneously through an orthogonal collocation on finite elements.

This tutorial covers MATLAB programming to simulate a differential equation model and optimize parameters to match measurements. In this exercise, the model is simulated with an ODE integrator (ode15s) and optimized with fmincon or fminsearch. A confidence interval for the parameter is also calculated. See https://apmonitor.com/me575/in....dex.php/Main/Dynamic

Euler's method can be used to simulate and optimize differential equations in Excel. This tutorial demonstrates the steps to set up the simulation and then match the response to data.

This tutorial is part 3 of 3 that gives an introduction to Python and how to solve a simple engineering analysis problem. In this case, there is a cylindrical tank that has an inlet flow. We want to determine whether that tank will overflow after 2 hours.

This tutorial problem shows how to solve for a tank volume, volume of the liquid, and determine if a tank capacity will be exceeded. This is part 2 of 3 with examples in VBA, MATLAB, and Python.

This basic Excel Macro tutorial demonstrates how to import and export values from a VBA program, display a message box, and write an IF statement. This video is followed by examples on writing this same program in MATLAB and Python.

This tutorial demonstrates how to solve a simple mathematical optimization problem with four variables, one objective function, one equality constraint, and an inequality constraint. The problem is solved with the APMonitor toolbox in Python.
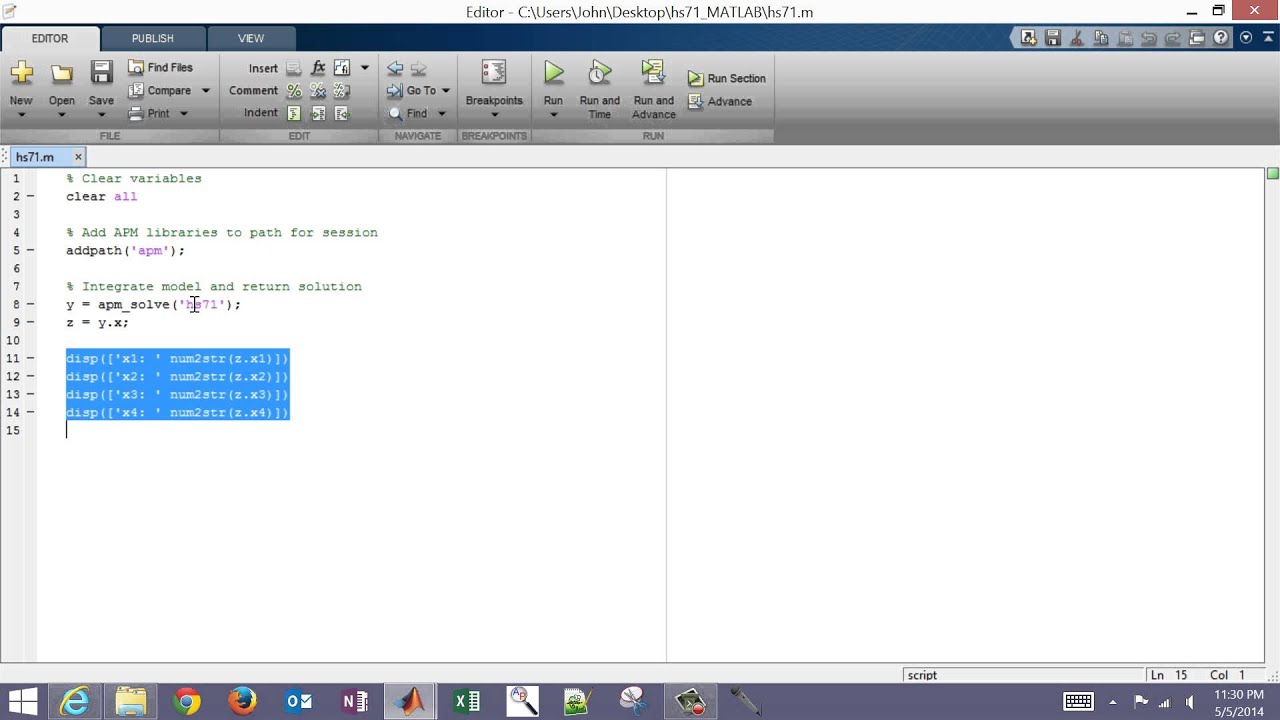
This tutorial demonstrates how to solve a simple mathematical optimization problem with four variables, one objective function, one equality constraint, and an inequality constraint. The problem is solved with the APMonitor toolbox in MATLAB.
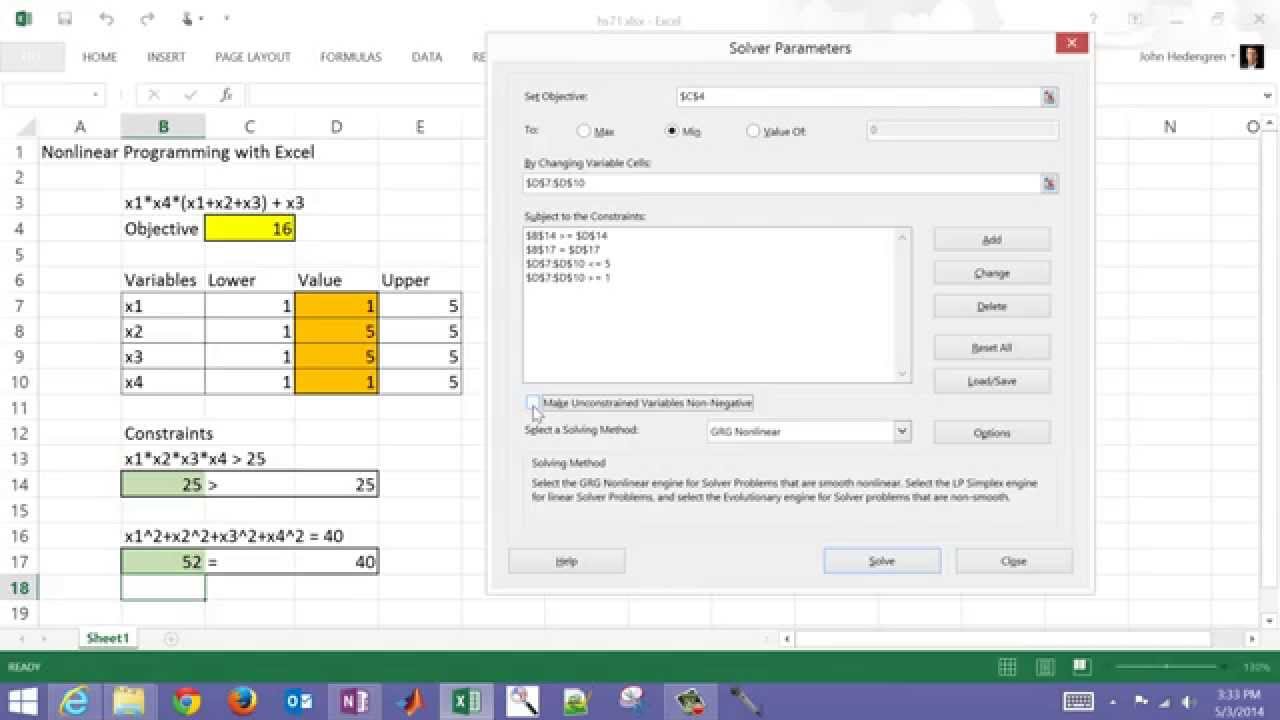
Excel Solver is a powerful tool for engineering optimization. This tutorial shows how to solve a simple benchmark problem with an objective function, inequality constraint, and an equality constraint.
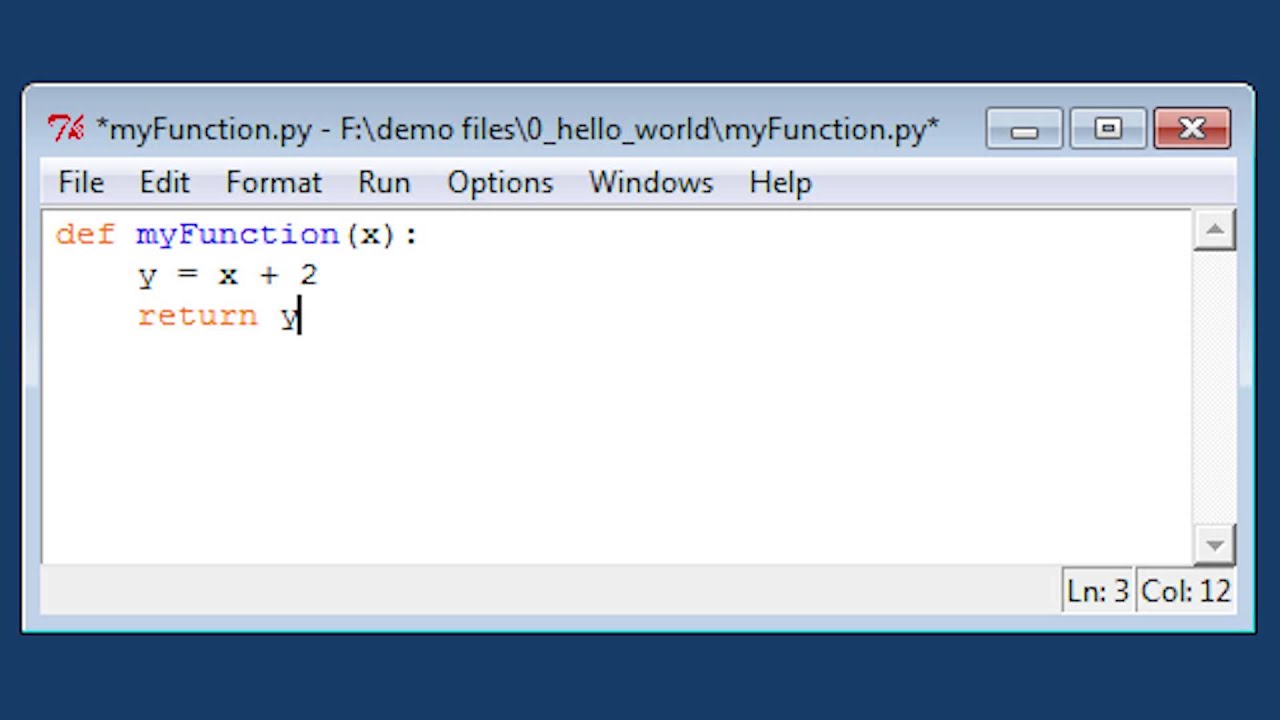
This "Hello, World!" introductory tutorial with Python demonstrates how to create a new script file, run in debug mode, calculate basic statistics, and produce a trend.
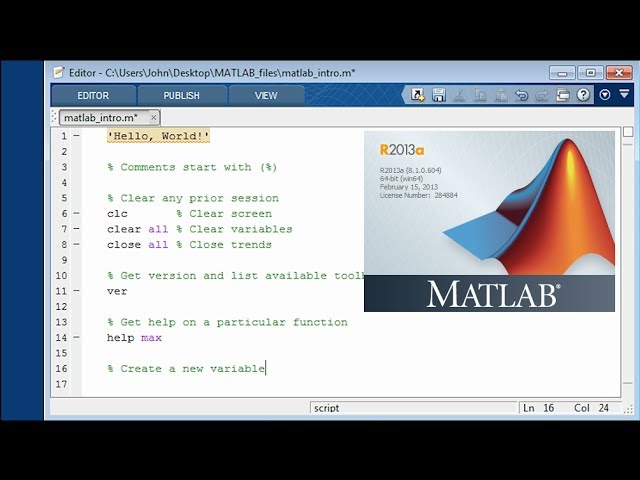
This "Hello, World!" introductory tutorial with MATLAB demonstrates how to create a new m-file script, run in debug mode, calculate basic statistics, and produce a trend.

Python programming language allows sophisticated data analysis and visualization. This tutorial is a basic step-by-step introduction on how to import a text file (CSV), perform simple data analysis, export the results as a text file, and generate a trend. See https://youtu.be/pQv6zMlYJ0A for updated video for Python 3.
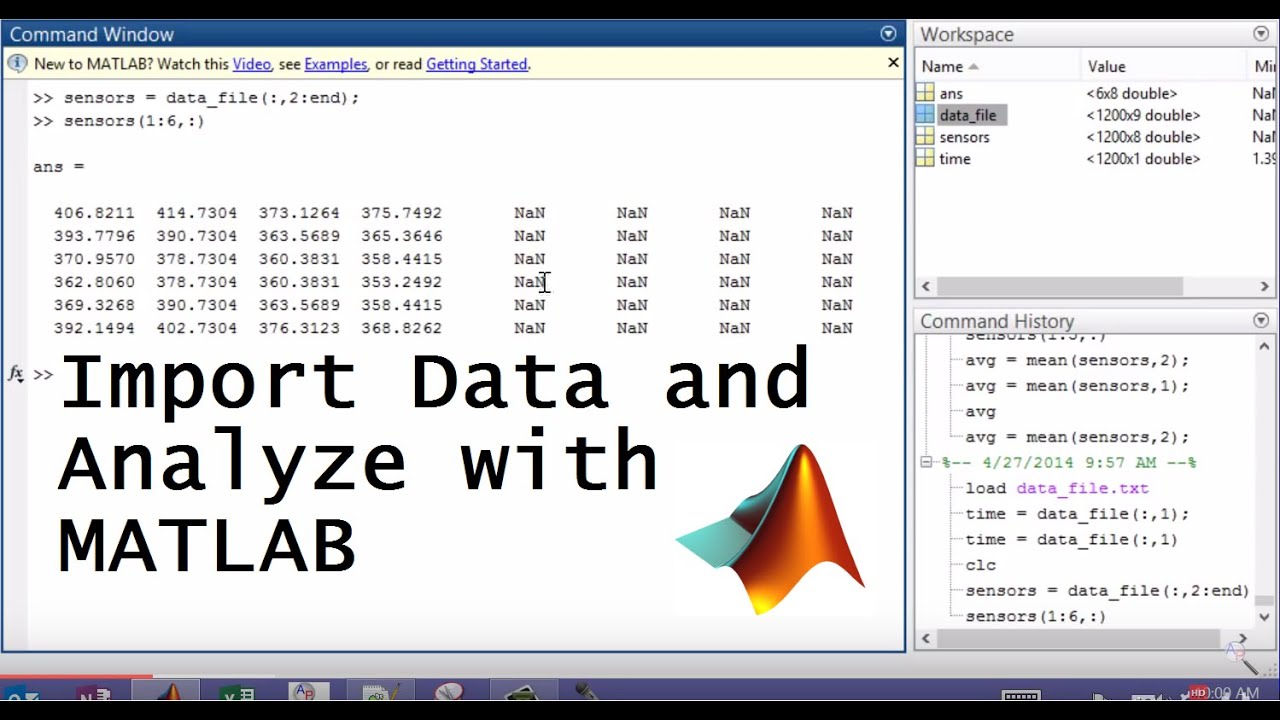
Data are frequently available in text file format. This tutorial reviews how to import data, create trends and custom calculations, and then export the data in text file format from MATLAB. Source code is available from http://apmonitor.com/che263/up....loads/Main/matlab_da
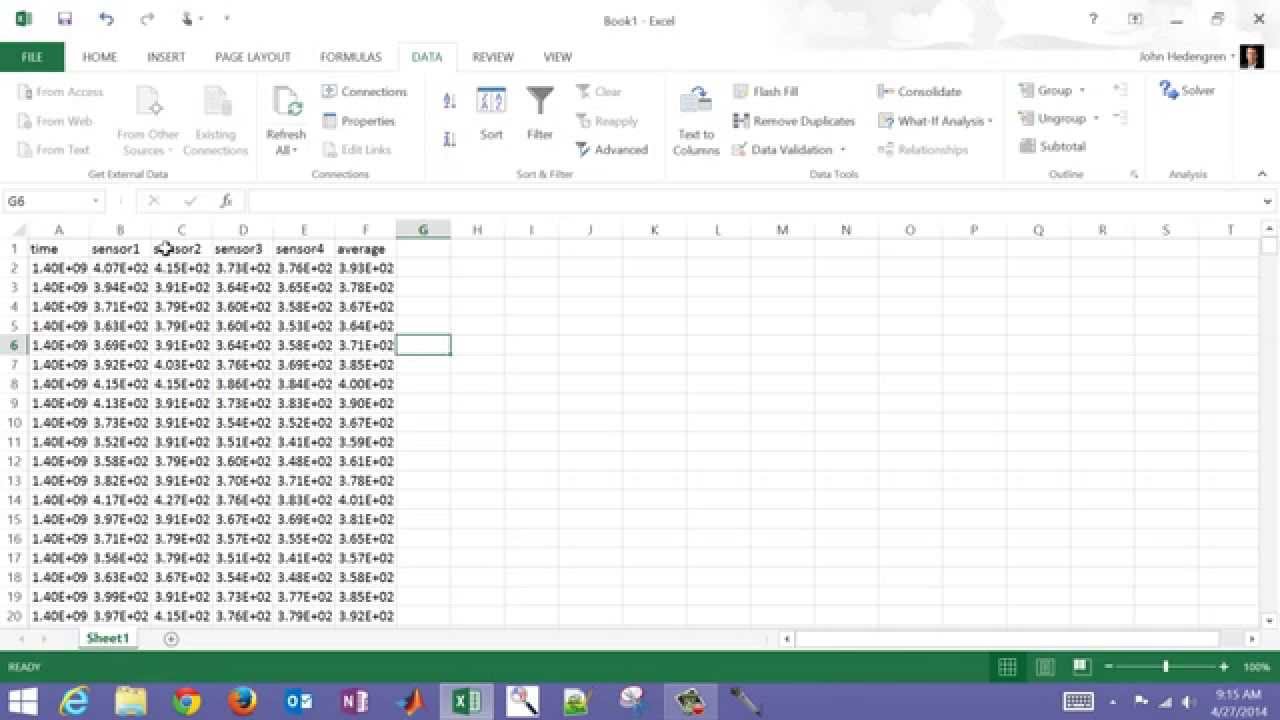
Excel enables import of many types of data including databases, web content, and text files. This tutorial reviews how to import data into Excel, perform a calculation on that data, create a trend, and export the data into another text file.

This introductory tutorial gives a basic review of maneuvering through a workbook, formatting cells, entering a formula, copying equations, and naming cells.

This is an introduction to the course on computational tools for engineers. It is taught particularly for chemical engineering students and covers topics such as data manipulation, optimization, building trends, analyzing data, solving problems, and creating software solutions. Visit http://apmonitor.com/che263 for additional information and course material.
